Pressure distribution over free-fall spillway
For the free-fall spillway only, the user can define the pressure profile from upstream to downstream, for both the operating and flood levels, as shown in Figure 126.
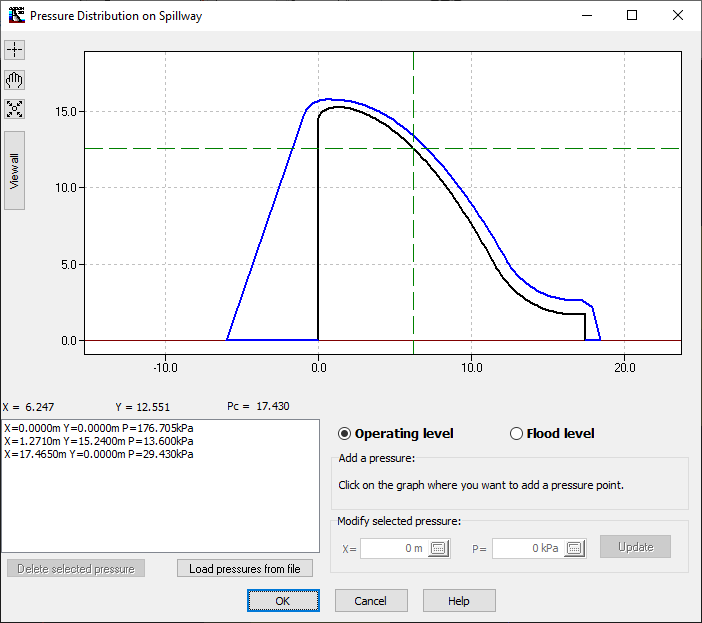
Figure 126
CADAM3D does not calculate the pressure distributions. It is up to the user to determine these distributions of pressure and introduce them using (a) simplified rules accepted in practice, (b) available tables in the literature, (c) the numerical solution obtained from a CFD - Computational Fluid Dynamic – software that is used more and more in practice..
CADAM3D offers two options to define pressures:
- By moving the cursor mouse over the graph, the crosshair (shown in green) identifies the closest point on the spillway perimeter. By clicking the left button of the mouse, the user can set the pressure value at that point (Figure 127). This new pressure value will be added to the pressure list consecutively from upstream to downstream.
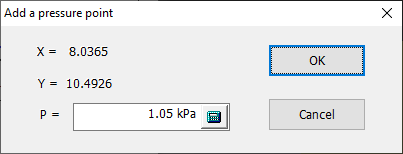
Figure 127
- By importing pressure distribution from a MS Excel file in format 97-2003 (*.xls). The MS Excel file must have three columns indicating the values of X, Y and the pressure respectively (see Figure 128). The values must absolutely start at the A1 cell of the MS Excel file. Units must be consistent, either in kPa or ksf.
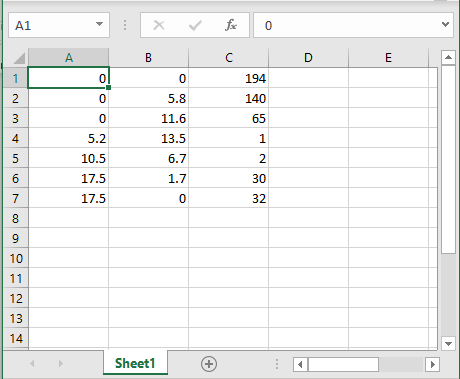
Figure 128
When the MS Excel file is completed and saved, the user can import the pressures using the Load pressures from File button (Figure 126). The name of the file is entered as shown in Figure 129. This new distribution will replace the previous one. In the event the coordinates X and Y do not exactly coincide with the spillway profile, CADAM3D will identify the closest point on the profile and change the coordinates accordingly.
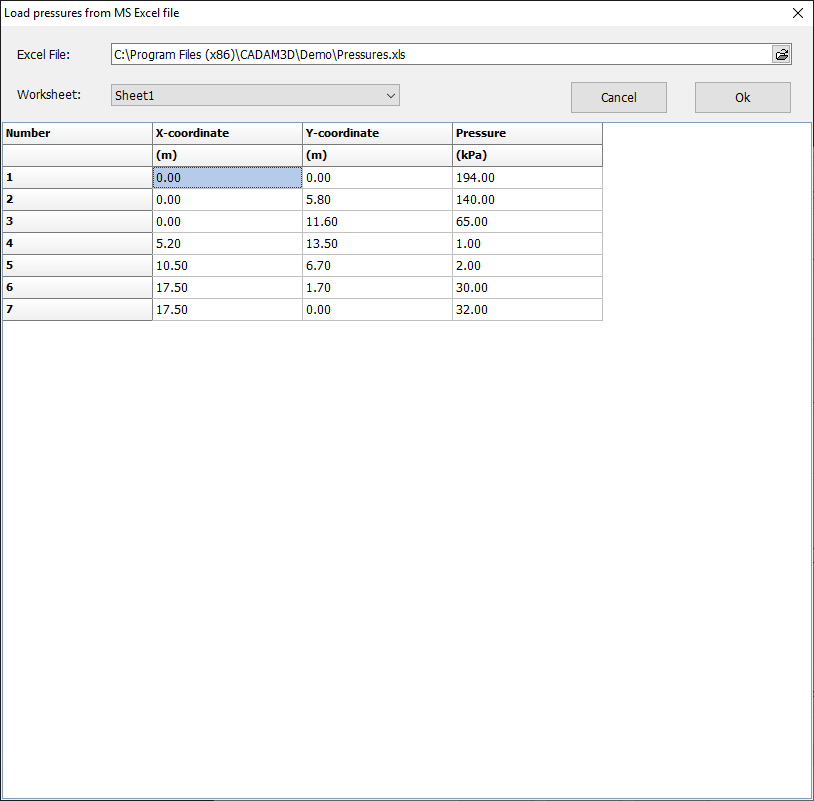
Figure 129
It should be noted that the Operating level option (outlined in green in Figure 130) is activated in this demonstration. For the Flood level, the above operations must be repeated. Selecting a different pressure from the list (Figure 130) allows the user to change the pressure (red ellipse) by changing the value of P in the editing box and then clicking the Update button.
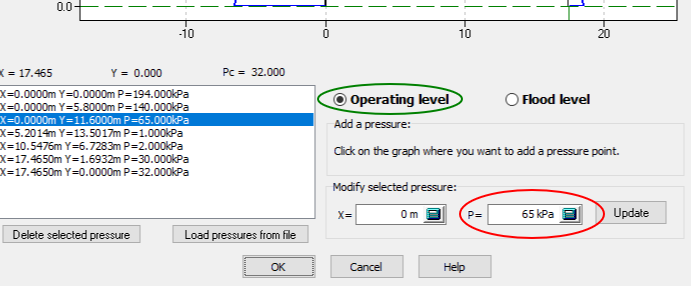
Figure 130